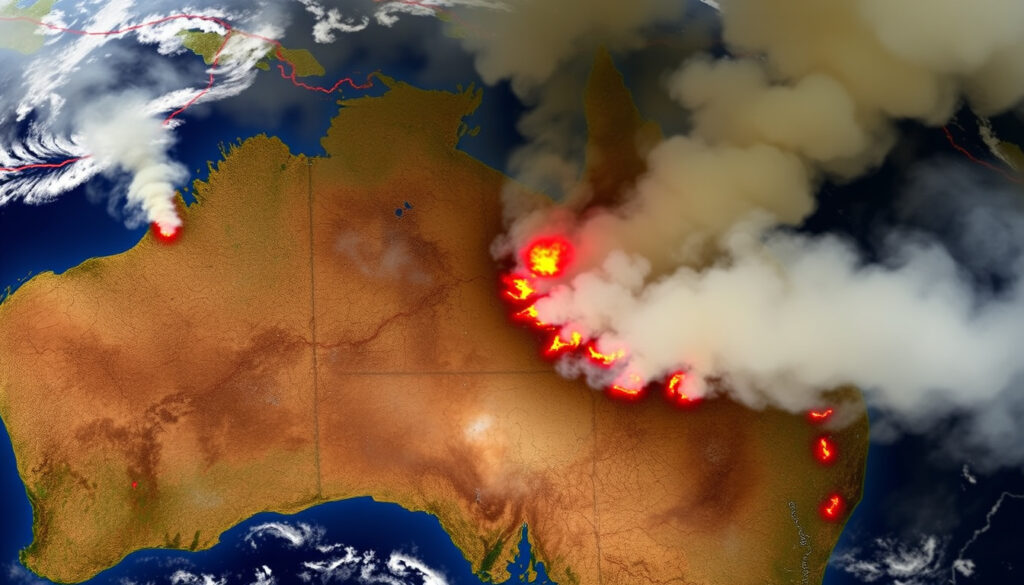
QLD Fire Map: Live Incidents, Warnings & Satellite Views
Queensland residents need reliable, official fire mapping tools that update faster than social media gossip but come with documented delays. The Queensland Fire Department runs several official mapping tools, but they come with quirks that catch most people off guard: data delays, warning levels that change fast, and satellite views that don’t always paint the full picture. This guide cuts through the noise and shows you exactly where to look, what each source actually tells you, and when to stop refreshing and call Triple Zero instead.
Primary Official Source: fire.qld.gov.au ·
Satellite Hotspot Viewer: arcgis.com map ·
Warnings and Incidents: getready.qld.gov.au ·
Bushfire Data Portal: data.qld.gov.au ·
Interactive Hotspots: myfirewatch.landgate.wa.gov.au
Quick snapshot
- Official QFD maps pull from the Computer Aided Dispatch (CAD) database (Queensland Fire Department)
- Dashboard refreshes every 5–10 minutes from ESCAD (Queensland Fire Department)
- Data feeds carry up to 5-minute delay after upload (Queensland Fire Department)
- Whether dedicated mobile apps offer advantages over web dashboards
- Exact current fire locations as of article date (dynamic data)
- Coverage specifics for regional Queensland beyond Whitsundays
- QFD dashboard last updated reference: 07 January 2025 (Queensland Fire Department)
- Air quality snapshot showed no elevated health action levels as of 23 January 2025 12pm (Queensland Government DETSI)
- MyFireWatch detects hotspots within the last 12 hours using red icons (Landgate)
- Satellite maps update every 2–4 hours vs QFD’s 5–10 minute dashboard cadence (Landgate MyFireWatch; Queensland Fire Department)
- Three-tier warning system continues guiding public response (Get Ready Queensland)
- Air quality monitoring remains active during fire season (Queensland Government DETSI)
| Resource | URL / Access Method |
|---|---|
| Official Incidents Page | fire.qld.gov.au/Current-Incidents |
| Satellite Map | ArcGIS Map Viewer |
| Bushfire Incidents | Get Ready Queensland |
| Hotspot Viewer | MyFireWatch (Landgate) |
| Data Resources | Queensland Government Open Data Portal |
QLD Fire Map Satellite
Satellite-based fire mapping gives you a broader view than any single ground sensor can offer. Two tools stand out for Queensland: the ArcGIS map viewer hosted by the Queensland Fire Department and MyFireWatch, run by Western Australia’s Landgate agency.
Accessing satellite views
The QFD ArcGIS dashboard displays current incident areas on an interactive map, but the symbols represent general zones rather than pinpoint locations. MyFireWatch takes a different approach—its red hotspot icons show areas where satellites detected heat above threshold within the last 12 hours. Accuracy is typically within 2km, though this stretches to 5km at map edges.
Interactive map viewers
Both platforms let you pan, zoom, and layer data. The ArcGIS viewer links directly from fire.qld.gov.au and pulls from official incident data. MyFireWatch offers a national view useful for spotting regional patterns across Queensland and neighboring states. Neither is designed for life-or-property decisions.
The Queensland Fire Department explicitly states that information on the Incidents map is extracted from the CAD database as a general indication of current activity—it is not real-time data, and symbols represent general areas rather than exact locations or fire spread.
— Queensland Fire Department
Current Fire Incidents Near Me
Finding fires near your location requires knowing which tool does what. The QFD Current Incidents page and the Get Ready Queensland hub are the two starting points that actually matter.
Location-based tracking
The QFD Current Incidents page pulls directly from the Computer Aided Dispatch database. This means you’re seeing verified, official data—though it carries a delay of up to 5 minutes after information uploads to the system. The QFD Active Incidents Dashboard refreshes every 5–10 minutes from ESCAD, giving you a snapshot that’s closer to real-time but still filtered.
QFD dashboard figures may differ from other official counts because the dashboard applies its own filtering logic. Always check the primary Current Incidents page for the most complete picture.
Near Brisbane and Gold Coast
South East Queensland has specific air quality monitoring, and the Queensland Government’s DETSI network tracks PM2.5 readings hourly. As of 23 April 2026 12pm, no elevated health action levels were reported for this region—meaning air quality was within safe limits at that snapshot. The Get Ready Queensland page links directly to QFD bushfire warnings, making it the quickest route to current incident status for Brisbane and Gold Coast residents.
Based on PM2.5 readings at air monitoring stations and smoke sensors, there are currently no elevated health action levels as of Thursday 23 April 2026 12pm.
QLD Fire Map Live App
Most readers searching for a “QLD fire map live app” are looking for something they can check on their phone without digging through a browser. Here’s what the official sources actually offer—and where the gap remains.
Live app options
The Queensland Fire Department does not list a dedicated mobile application in its primary resources. Instead, both the Current Incidents page and the Incident Dashboard are mobile-responsive web applications that work through any browser. The RFBaq (Rural Fire Brigades Association Queensland) lists the official QFD dashboard as the primary resource for bushfires, incidents, permitted burns, and warnings.
Community apps like Fireguard (available on Google Play) offer satellite hotspot overlays and burned area tracking, but they’re third-party tools. For authoritative information tied to official responses, the QFD web dashboards remain the most reliable option.
Free download availability
No official QFD-branded app appears in top search results for free download. Third-party alternatives exist, but they don’t replace the official feeds. Your best move: bookmark the Current Incidents page and the Get Ready Queensland hub on your phone’s home screen.
Current Fires QLD
Beyond maps, Queensland offers text-based feeds and warning systems that update without requiring you to load an interactive interface. These are particularly useful during mobile data crunches or when web traffic spikes slow down map loading.
Latest incidents
The QFD Current Incidents page offers both an RSS Text feed and a Common Alerting Protocol (CAP-AU) feed for current bushfire warnings. Both carry the same up-to-5-minute delay as the interactive map. The Rural Fire Brigades Association Queensland resource page links to QFD dashboard views for permitted burns and warnings.
Warnings feeds
Queensland uses a three-tier warning system: Emergency Warning (red, indicating immediate life danger), Watch & Act (orange, heightened threat), and Advice (yellow, stay informed). Get Ready Queensland defines these levels clearly and directs users to QFD for the most current information.
Don’t wait for an official warning to act if a fire is visibly approaching. The Queensland Fire Department advises: “Don’t assume that because you have not received a official warning the fire will not affect you. Take notice and act.”
QLD Emergency Map
The term “QLD Emergency Map” typically points to either the Get Ready Queensland hub or the broader Queensland Disaster Management portal. Both route back to the QFD tools covered above, but they add context around preparedness.
Official emergency resources
Get Ready Queensland is the state’s official emergency preparedness platform. Its current bushfire incidents page defines warning levels, links to QFD maps, and provides guidance on what to do before, during, and after a fire. The site also directs users to the Queensland Government Open Data Portal for warnings data and mapping resources.
Bushfire warden info
The RFBaq emergency resources page lists QFD dashboard access alongside Fire Danger Ratings available from the Bureau of Meteorology website. Air quality data for South East Queensland and Mount Isa is accessible through the DETSI monitoring network, which updates hourly.
Understanding Update Cadences and Data Limits
One of the most common mistakes people make is treating official fire maps as live television. Here’s how each source actually works.
| Source | Update Frequency | Accuracy | Best For |
|---|---|---|---|
| QFD Dashboard | 5–10 minutes | General area, not real-time | Official incident list |
| QFD Data Feeds | Up to 5-minute delay | Same as dashboard | RSS/CAP feed users |
| MyFireWatch | 2–4 hours | Within 2km (5km at edges) | Satellite hotspot overview |
| Air Quality (DETSI) | Hourly | PM2.5 monitoring stations | Health impact assessment |
How to Report a Fire
If you spot a fire, the process is straightforward: call Triple Zero (000). The Queensland Fire Department confirms this as the primary reporting method. For non-emergency fire sightings, the QFD website provides contact options.
No map or app replaces the speed of a 000 call when a fire is threatening life or property. Use the official maps to monitor situations before they become emergencies.
What official sources confirm
- Official maps at fire.qld.gov.au and getready.qld.gov.au use CAD/ESCAD data
- Satellite data available at arcgis.com and myfirewatch.landgate.wa.gov.au
- Warning levels: Emergency Warning, Watch & Act, Advice (3 tiers)
- Data delays exist: 5–10 minutes for QFD, 2–4 hours for satellite views
What remains unclear
- Dedicated mobile app availability from QFD
- Exact active fire locations at time of reading
- Free download options for official tools
- Regional coverage details beyond major centres
MyFireWatch allows you to interactively browse satellite observed hotspots. This information is not to be used for the preservation of life or property.
— Landgate
For Queensland residents, the choice is straightforward: rely on official QFD dashboards for incident details, use MyFireWatch for broad satellite context, and always keep 000 on speed dial. Satellite views help you understand regional risk patterns, but they lack the timeliness and specificity needed for active response. Bookmark the key resources before fire season hits—because when the smoke appears, you won’t have time to search.
Related reading: Temporary Graduate Visa (485): Requirements & Guide 2024
Residents tracking live QLD fire incidents should also monitor current QLD fire bans through official government dashboards for full compliance.
Frequently asked questions
How often are QLD fire maps updated?
The QFD Active Incidents Dashboard refreshes every 5–10 minutes from the ESCAD database, while satellite-based tools like MyFireWatch update every 2–4 hours. Data feeds carry an up-to-5-minute delay after upload. No official source offers true real-time mapping.
Can I use QLD fire maps for emergency decisions?
The Queensland Fire Department explicitly states that its incident map is “a general indication of current activity,” not real-time data. Symbols represent general areas, not exact fire perimeters. For life-threatening situations, call Triple Zero (000) immediately.
What devices support QLD fire map viewers?
The QFD Current Incidents page and Incident Dashboard are web-based and mobile-responsive, working on any browser across desktop, tablet, and smartphone. There is no official QFD-branded mobile app as of this article’s publication.
How to report a fire in QLD?
Call Triple Zero (000) for any fire threatening life or property. For non-emergency sightings, use the contact options listed on the Queensland Fire Department website. Never rely on a map to report an active blaze.
Are there alerts for QLD bushfires?
Yes. The QFD offers RSS Text feed and Common Alerting Protocol (CAP-AU) feed subscriptions for current bushfire warnings. You can also follow QFD on Facebook and X, or tune into local radio for real-time updates during active incidents.
What is the difference between fire warnings and incidents?
Incidents show active fires and emergency responses reported through the CAD system. Warnings indicate the threat level to affected areas: Emergency Warning (red, take immediate action), Watch & Act (orange, be alert), and Advice (yellow, stay informed). Both appear on QFD dashboards.
How to zoom into local areas on QLD fire maps?
Both the QFD ArcGIS dashboard and MyFireWatch support standard map controls: pinch-to-zoom on mobile, scroll wheel on desktop, and layer toggles to show different data sets. MyFireWatch offers national coverage for context; QFD maps focus on Queensland incident data.
More related posts
 Howard Lutnick: Net Worth, 9/11 & Trump Commerce Secretary
 Andrew Lincoln: Why He Left The Walking Dead & More
 Jack Nicholson: Health, Family, Career & Latest Updates
 RBA Meeting Dates 2026: Next Meeting & Full Schedule
 Hash Brown Recipe – Crispy Air Fryer Guide in 20 Minutes
 Pharrell Williams: Synesthesia, Net Worth, Louis Vuitton & Family
 Atom Eve: Powers, Relationships, and Origins Explained
 Julie Bowen: Heart Condition, Plastic Surgery, and Fitness
